Keeping track of employee performance allows you and your employees to grow the business together. Using these reports opens up the doors to communication, growth, leadership, and with the difficulty of finding the right staff, these reports are more important than ever.
It is possible to identify whether technicians are properly using DVI inspections or if a service advisor could benefit from some training by using a service advisor close ratio, which should be 50% or higher. You can identify trends in the shop with the technician and service advisor reports so you can make the necessary adjustments or get an employee to assist and lead you.
In your Employee Reports, you can now measure real time car count and sales amount per technician. This will allow you to measure performance and track your weekly sales goals.
The Reports section is located on the left navigation menu and has multiple types of real time technician reporting:
- Job Board + Posted Real Time Reporting - This report will show data for repair orders on your active job board as well as any posted repair orders within the time frame selected.
- Job Board Real Time Reporting - This report will show data for repair orders on your active job board only.
- Posted Real Time Reporting - This Report will show data for only posted repair orders.
- Jobs Created Real Time Reporting - This report will show data for the amount of jobs created within the time frame selected.
Depending on what view you of the report you are looking at, the numbers will differ in the graphs and the technician lists. Below is a brief explanation of each graph and the associated status lists.
Graph Options:
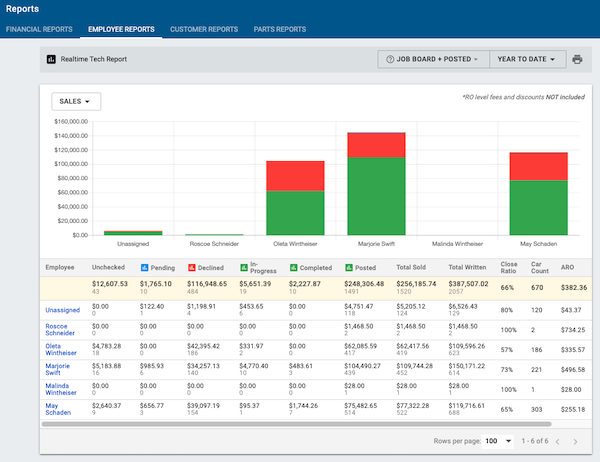
Sales Graph - depending on what report you are looking at, the sales bar graph shows the shows the dollar amount sitting on your active job board (and/or posted) along with the associated technician. This sales amount does account for job level fees and discounts but does not account for RO level fees and discounts.
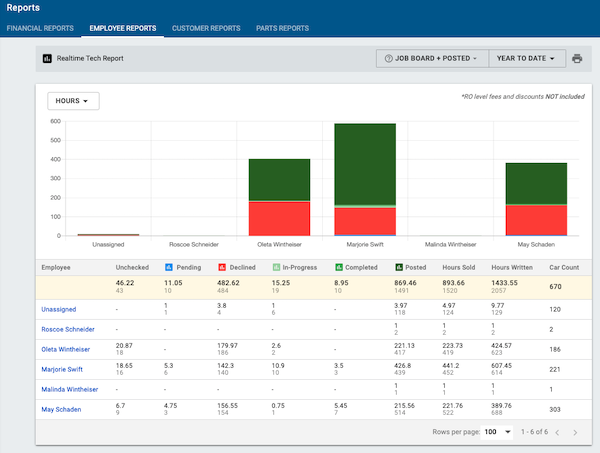
Hours Graph - depending on what report you are looking at, the hours bar graph shows the shows amount of labor hours sitting on your active job board (and/or posted) along with the associated technician.
Color Code:
- Blue - Sales/Hours are Pending Authorization
- Green - Sales/Hours have been Approved
- Red - Sales/Hours have been Declined
Technician Status List for Sales Graph - lists the status of the jobs that the technicians have created along with the dollar amount.
-
Unchecked - Dollar amount that is a draft job and hidden from your customers
-
Pending - Dollar amount that is still pending authorization from your customers
-
Declined - Dollar amount that has been declined by your customers
-
In-Progress - Dollar amount that is actively being worked on in your shop
-
Completed - Dollar amount of jobs that have been completed in your shop
-
Posted - Dollar amount of jobs that have been completed and paid for in your shop
-
Total Sold - Total dollar amount sold
-
Total Written - Total dollar amount written
-
Close Ratio - Amount Approved/Amount Written
-
Car Count - Total amount of ROs for each status
-
ARO - Average Repair Order Dollar Amount
-
AWRO - Average Written Repair Order Dollar Amount
Example Graph:
Technician Status List for Hours Graph - is a list of all the technicians and total hours for the following statuses:
-
Unchecked - Amount of labor hours that in draft jobs and hidden from your customers
-
Pending - Labor hours that still need to be authorized by your customers
-
Declined - Labor hours declined by your customers
-
In-Progress - Labor hours that are actively being worked on in your shop
-
Completed - Labor hours have been completed in your shop
-
Posted - Labor hours completed and paid for in your shop
-
Hours Written - Total amount of hours written
-
Car Count - Total amount of ROs for each status
Example Graph: